Description
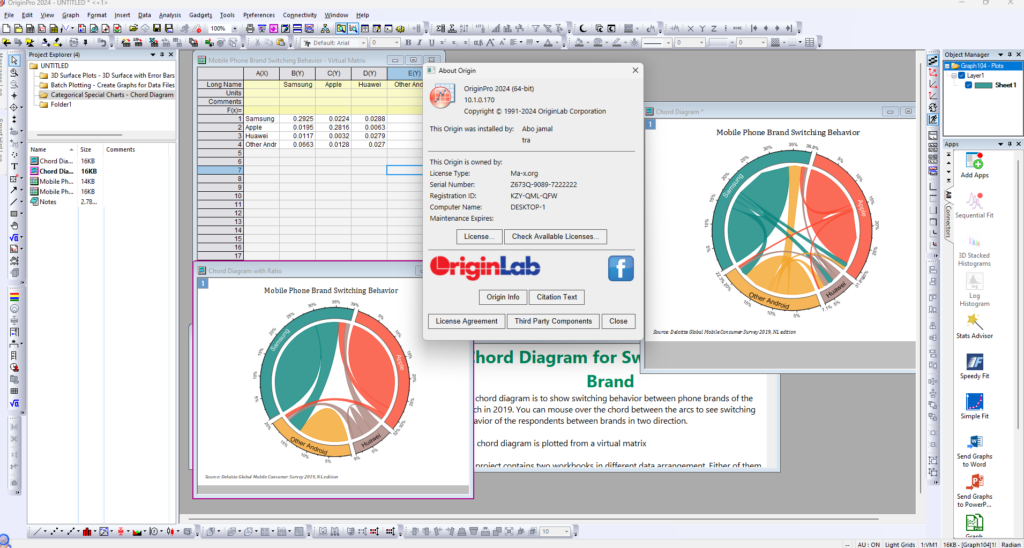
Origin Pro 2024a SR1 Full Cracked By Ma-x Group
$10.00 Original price was: $10.00.$5.00Current price is: $5.00.
Some Antivirus False Positive Detect our crack and hardware Generator -please stop antivirus or add exception.
Please check virustotal scan results
Only logged in customers who have purchased this product may leave a review.

qqmal –
crack working good thanks
luis.antony (verified owner) –
Good quality.